© 2025 Procter & Gamble
4/15/2025
Learn about our brands’ inclusive products and packaging that also help consumers live more sustainably.
Read more
4/10/2025
Meet the Starks Family: Shared values and experiences make P&G feel like home.
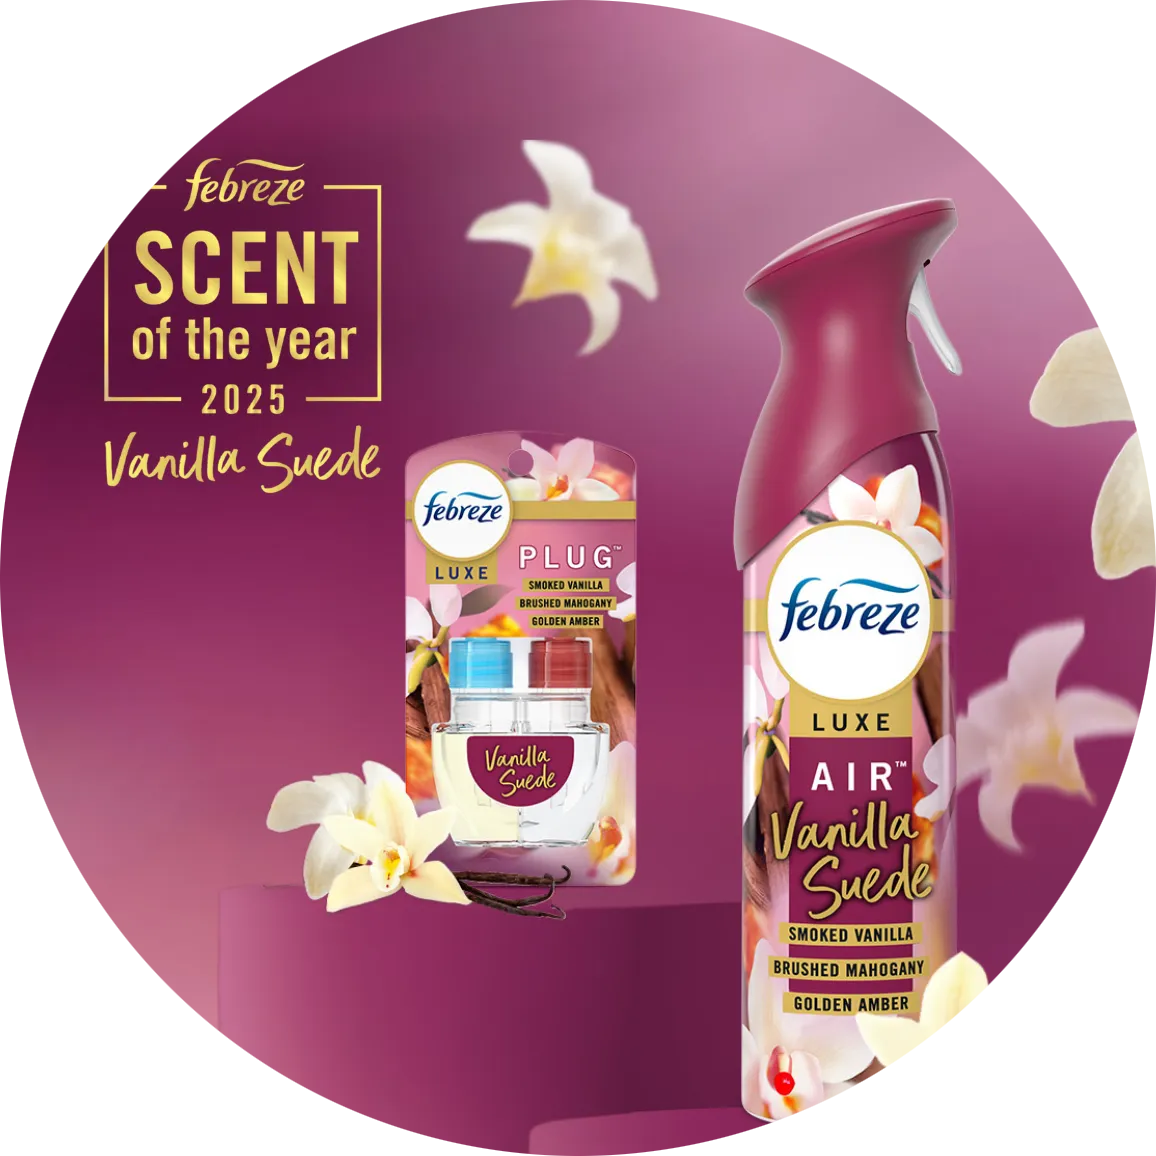
Elevate your home with the scent of comfort and indulgence: Febreze Selects Vanilla Suede as the 2025 Scent of the Year.
4/5/2025
Learn how P&G embeds sustainability into our company’s business strategy.
4/9/2025
Febreze Reveals Vanilla Suede as its 2025 Scent of the Year
Read More
4/8/2025
P&G Declares Dividend Increase
3/27/2025
P&G to Webcast Discussion of Third Quarter 24/25 Earnings Results on April 24
P&G and the National Basketball Athletic Equipment Managers Association (NBAEMA) Team Up to Power Laundry Solutions
Logos
Media Gallery
Videos
If you’re a journalist looking to reach a Company representative on our latest news, please email us with your contact information and deadline.
MediaRelations@shared.pg.com
Sign up to have P&G news releases delivered to your email inbox!